AI Gantt Chart Maker for Project Timelines
Create professional Gantt charts in seconds—designed specifically for presentations, planning, and real-time project tracking.
Create professional Gantt charts in seconds—designed specifically for presentations, planning, and real-time project tracking.

RocketSlide’s AI-powered presentation tool helps you plan, visualize, and present project timelines with ease. Design charts by simply entering your tasks, dates, and milestones— and our AI instantly generates a clean, professional Gantt chart that fits seamlessly into your presentation slide.
Why teams choose RocketSlide for their project visualization
Turn project details into a structured, visually engaging Gantt chart in seconds.
Adjust colors, durations, milestones, and layouts to match your brand style.
Automatically organizes tasks, timelines, and dependencies with intelligent accuracy.
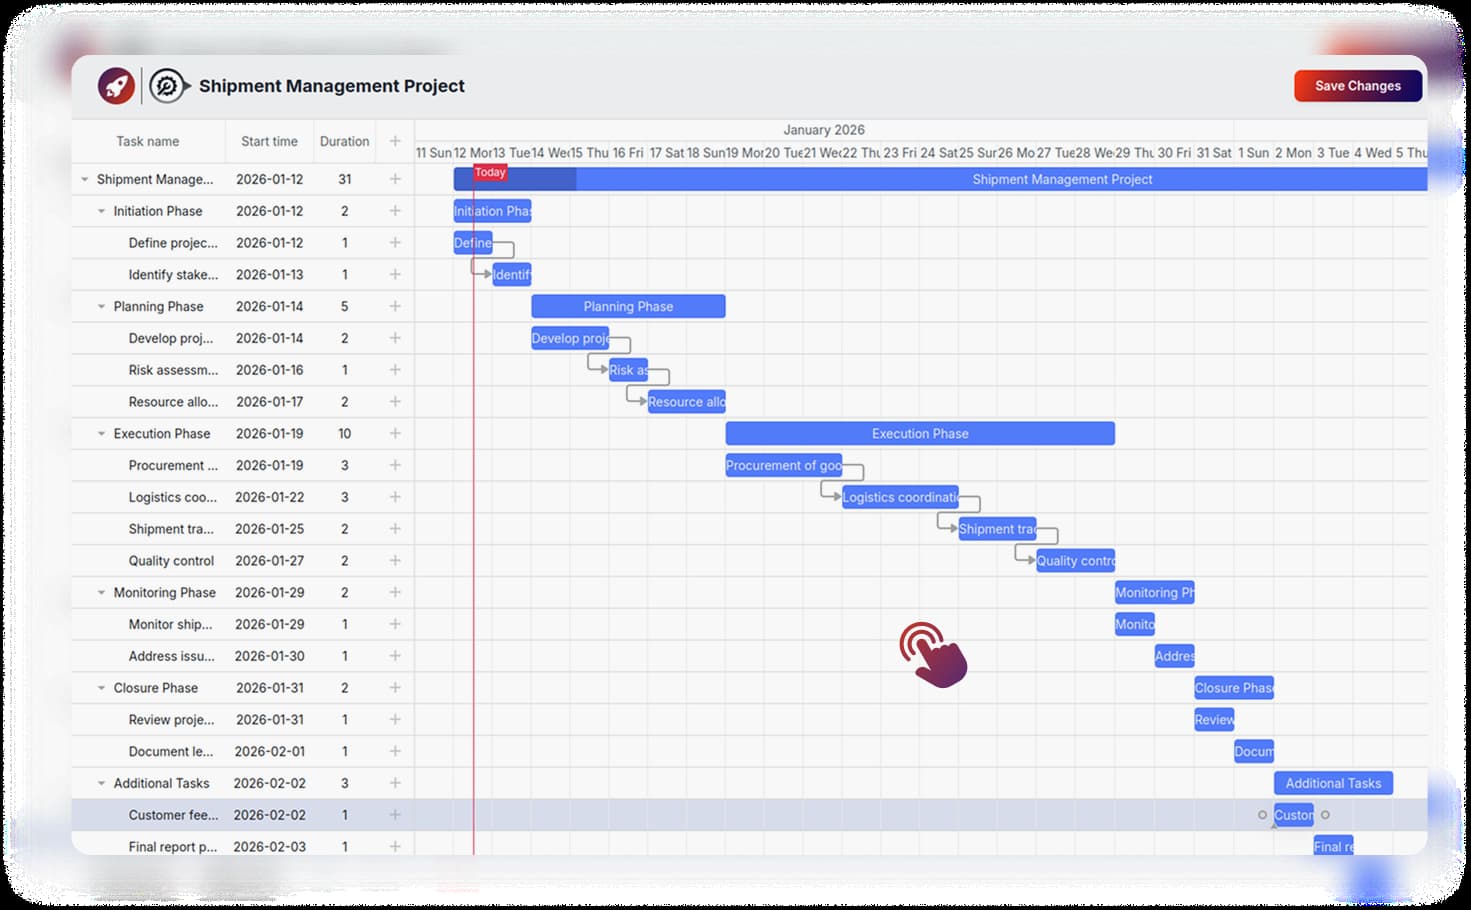
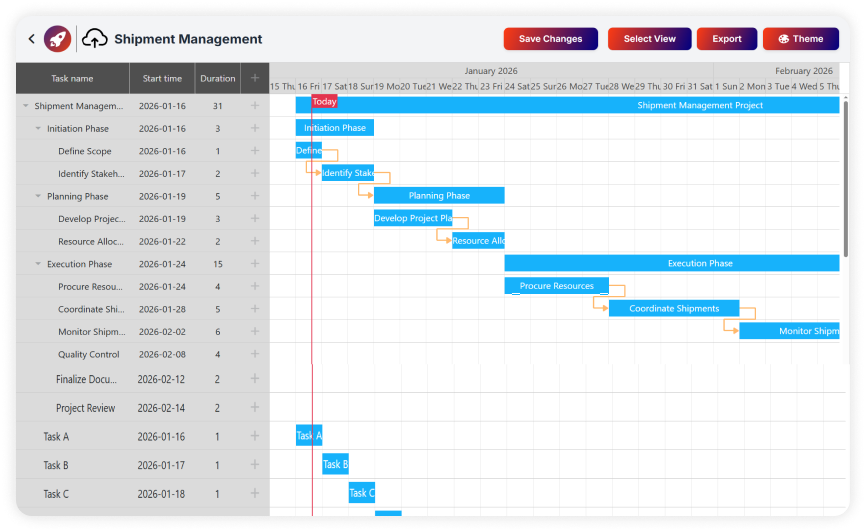
Turn real project data into a clean, visual Gantt chart—just like the Shipment Management timeline shown here. Add tasks, phases, start dates, and durations, and RocketSlide instantly maps everything into a structured timeline slide.
Create presentation-ready Gantt charts in just three simple steps.
Enter your tasks, start dates, durations, and milestones—or paste them from your notes.
RocketSlide instantly creates a structured, visually clear timeline inside your slide.
Edit colors, labels, and layouts. Then present directly or export as PPT/PDF with ease.
Who is this AI Gantt Chart Maker for? Professionals across industries use RocketSlide to present timelines faster.
Visualize sprints, launches, and deadlines in engaging, presentation-ready timelines.
Deliver client-ready timelines without extra design or manual charting work.
Translate roadmaps into clear, visual plans stakeholders understand immediately.
Create academic project timelines that are easy to explain and present to students.
Combine timelines with RocketSlide’s presentation templates for a complete, professional deck.
Everything you need to know about our productivity suite.
Yes—tasks, dates, durations, and milestones are fully editable anytime directly in the interface.
Absolutely. It’s designed specifically for slide integration and presentation-ready high-fidelity visuals.
Export your chart as part of your presentation in PPT or PDF format with one click.
No. The AI handles structure and formatting automatically, so you can focus on insights and planning.
Create a professional Gantt Chart in minutes, not hours.